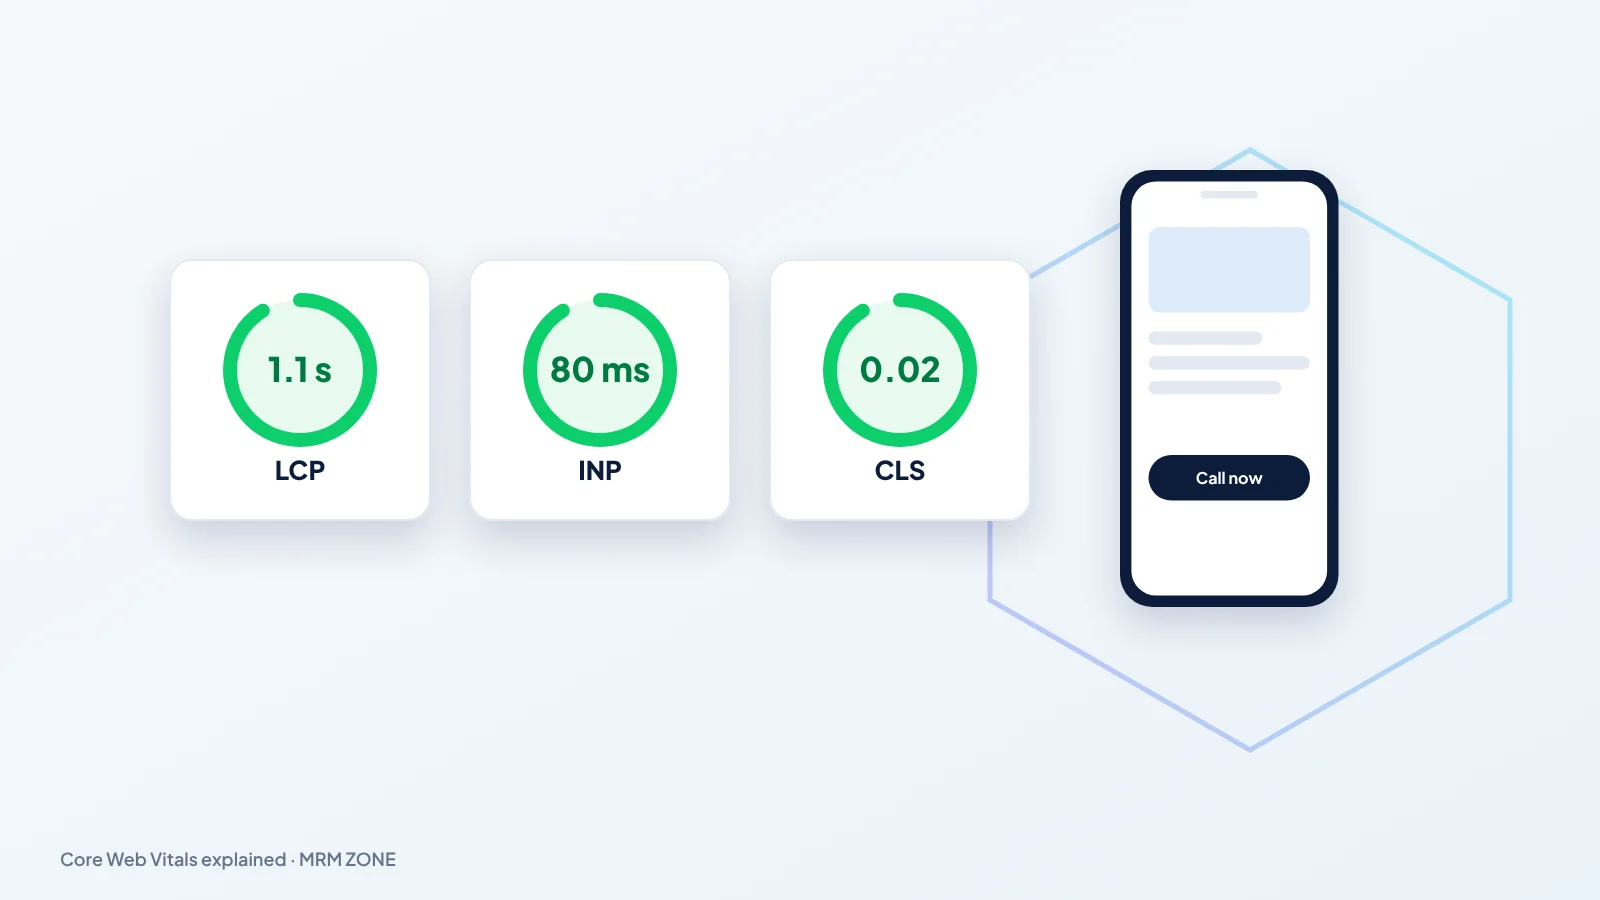
What Core Web Vitals are
Core Web Vitals are three measurements Google uses to judge how a page feels to real visitors. They are part of Google's page experience signals, and the definitions and thresholds are published on web.dev, Google’s own guide to Web Vitals. They will not lift a weak page above a much more relevant one, but between similar pages a faster site has an edge, and a fast site loses fewer visitors before they call.
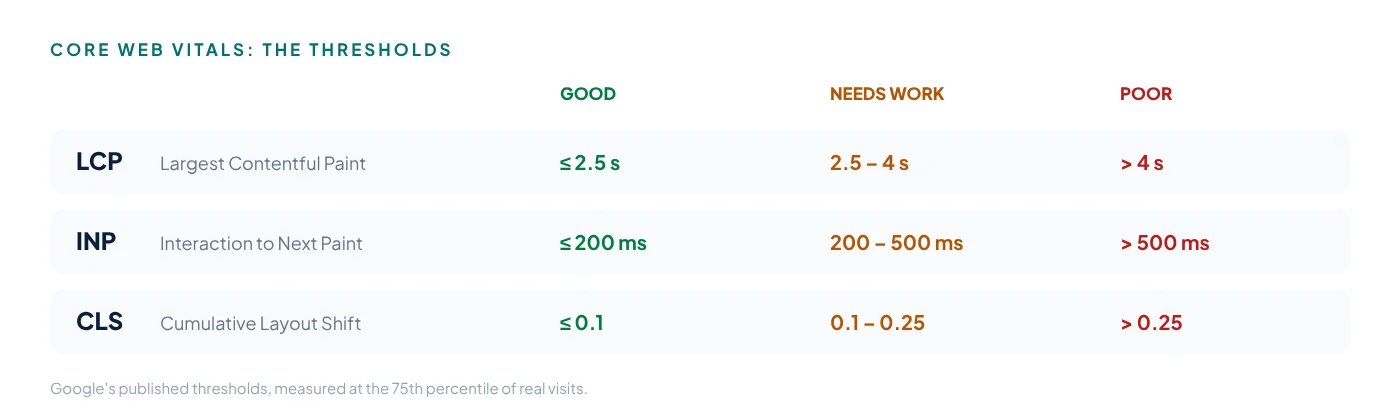
- LCP (Largest Contentful Paint): how long the main content, usually the hero image or headline, takes to appear. Aim for 2.5 seconds or less.
- INP (Interaction to Next Paint): how quickly the page responds when someone taps a button or opens a menu. Aim for 200 milliseconds or less.
- CLS (Cumulative Layout Shift): how much the page jumps around while loading. Aim for 0.1 or less.
Google looks at the 75th percentile of real visits, so most of your visitors need a good experience, not just you on office Wi-Fi.
How to check your site for free
- Go to pagespeed.web.dev, enter your homepage and run the test. Check the mobile result first, because most local searches happen on phones.
- The top section shows real-user data if your site has enough traffic; the lower section is a lab test with specific suggestions.
- In Google Search Console, open Core Web Vitals to see which groups of pages pass or fail on mobile and desktop.
The usual problems on trade websites
- Huge photos. Project galleries uploaded straight from a phone are often 3–6 MB each. This is the most common cause of slow LCP.
- Page builders and plugins that load large scripts on every page, slowing down taps and menus (INP).
- Images and ads without set sizes, and late-loading cookie banners or chat widgets, which make content jump (CLS).
- Cheap or overloaded hosting that takes a long time to send the first byte.
Fixes that make the biggest difference
- Resize and compress images, serve them as WebP and lazy-load images below the first screen.
- Give every image and embed a width and height so the layout stays still.
- Remove plugins and third-party scripts you don't need; load chat widgets after the page.
- Use good hosting with caching and compression switched on.
- Keep fonts to one or two families and host them yourself.
Re-test after each change, then watch the Core Web Vitals report in Search Console over the next 28 days, because field data updates slowly.
How to read a PageSpeed Insights report without panic
The big coloured score at the top of PageSpeed Insights is a lab score from one simulated visit on a slow phone. It is useful for spotting problems, but it is not what Google uses for ranking. The section above it, Discover what your real users are experiencing, is the field data, and that is the part that counts. If it says your page passes the assessment, you are in good shape even if the lab score is 70.
Small sites often see no data in the field section. That simply means Google has not collected enough visits yet. In that case the lab result is your best guide: fix what it lists under Diagnostics, starting with the items that mention the largest savings in seconds or kilobytes.
Do not chase a perfect 100 on every page. A service business gains far more from getting the homepage and the top five service pages into the green than from polishing a blog post nobody visits.
Which pages to fix first
Open the Pages report in Search Console and sort by clicks. The pages that already bring visitors, usually the homepage, the main service pages and the contact page, are where a speed improvement turns into more calls fastest. Then look at the Core Web Vitals report: it groups similar URLs together, so fixing one template (for example all service pages) often fixes dozens of URLs at once.
A short brief for your web developer
If someone else maintains your site, send them this list. It covers most of what we fix on trade websites:
- Serve images in WebP or AVIF, sized to the space they fill, with
widthandheightattributes. - Preload the hero image and do not lazy-load anything in the first screen.
- Remove unused plugins, sliders and animation libraries; defer chat, review and analytics widgets until after load.
- Self-host fonts, limit them to two weights each, and use
font-display: swap. - Turn on server caching, Brotli or Gzip compression and a CDN if visitors come from more than one country.
- Reserve space for cookie banners and embeds so nothing pushes the content down.
Ask for before and after PageSpeed Insights screenshots for mobile. A good developer will be happy to show them.
Myths about speed and rankings
“A 100 score will put me on page one.” It will not. Relevance, reviews and links matter far more; speed is a tie-breaker and a conversion booster. “My site is fast on my computer, so it is fine.” Most local searches happen on phones over mobile data, and that is what the field data measures. “Speed is a one-off job.” Every new plugin, gallery and tracking script slows the site down again, so re-test after each change and check the report every month.
When to rebuild instead of patching
If a site is built on a heavy theme with dozens of plugins, fixing it piece by piece can cost more than a clean rebuild. A lean, well-built service website can load in about a second on mobile and is easier to keep fast.
What a roofing site should look like after a rebuild is in roofing website design that converts, and a one-day clean-up is shown in our page speed case study.
Related articles
 Lost Google rankings? Why your website dropped, and how to recoverLost Google rankings? The common causes of sudden drops (updates, technical errors, spam, thin content, lost l…
 SEO for cladding and façade companies: winning specifiers and homeownersSEO for cladding and façade companies: get found on Google by architects, builders and homeowners, with the pa…
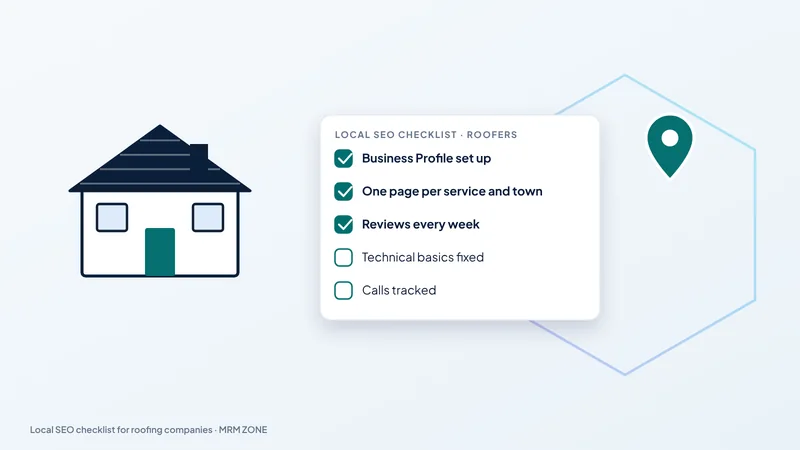 A local SEO checklist for roofing companiesA practical local SEO checklist for roofers: Business Profile, town pages, reviews, citations and tracking, in…
Want us to check this on your own site? Ask for a free audit and we'll send the first fixes we'd make.